
 STB
Surface
STB
SurfaceThe Surface Transportation Board collects a series of economic data for regulatory purposes and to monitor the financial health of the freight railroad industry. Descriptions of the data collected by the Board and links to the data are provided below. Such data has been divided into two categories:
Data that the Board issues in regulatory proceedings
- Revenue Deflators
- Revenue Shortfall Allocation Methodology Figures
- Cost of Capital Figures
- Revenue Adequacy Figures
Data that is submitted by the railroads and posted by the Board
- Annual R-1 Reports
- Revenues & Earnings
- Carloads & Volumes
- Employment & Wage
- Fuel Surcharges
Note that this page does not contain information regarding the following three items, as there are separate pages devoted to those topics:
Rail Cost Adjustment Factor Uniform Rail Costing System Carload Waybill Sample
Need Assistance: Blank versions of these forms are provided below, as well as a table showing the due dates for the various required reports. For questions about the data displayed on this page, please contact the Office of Economics at .
Data Issued in Regulatory Proceedings
For regulatory purposes, the Board categorizes rail carriers into three classes: Class I, Class II, and Class III. The classes are based on the carrier’s annual operating revenues and are presented in nominal terms at 49 C.F.R. § 1201 (1-1 Classification of Carriers).
To account for inflation, the Board calculates Deflator Factors to adjust railroad annual operating revenues based on a 2019 benchmark. The railroad revenue deflator formula is based on the annual average of the Producer Price Index for line-haul railroads, published by the Bureau of Labor Statistics. The formula is as follows:
Current Year’s Revenues × (2019 Average Index/Current Year’s Average Index).
Using the deflator factors, the Board calculates the annual revenue threshold for classification purposes. For 2025, the most recent year for which deflator factors have been calculated, the figures are provided below:
- Deflator Factor: 0.8221
- Threshold for Class I carriers: $1,094,774,354
- Threshold for Class II carriers: $49,143,204
Beginning with year 2017, the Board began publishing the deflator factors in Indexing the Annual Operating Revenues of Railroads, Docket No. EP 748. To view the deflator factors and thresholds, click here.
Revenue Shortfall Allocation Method (RSAM), measures the average mark up that the railroad would need to charge all of its “potentially captive” traffic in order for the railroad to earn adequate revenues as measured by the Board under 49 U.S.C. § 10704(a)(2). RSAM is one of three benchmarks that together are used to determine the reasonableness of a challenged rail rate under the Board’s “Three-Benchmark” approach available for small disputes.
Each year, the STB adopts weighted average state tax rates for the Class I railroads for use in RSAM in Docket No. EP 682 and determines each railroad’s RSAM in Docket No. EP 689.
Below are the RSAM calculations for 2024.
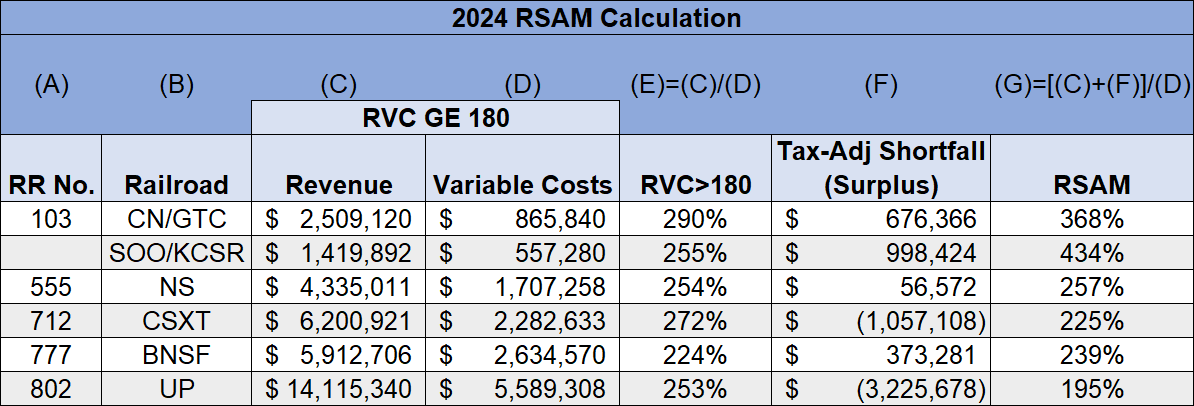
- 2024 RSAM Calculation (XLSX)
- 2021 – 2024 RSAM Table (XLSX)
- 2024 Tax Information For Use in the Revenue Shortfall Allocation Method, EP 682 (Sub-No. 16)
- Simplified Standards for Rail Rate Cases—2024 RSAM and R/VC>180 Calculations, EP 689 (Sub-No. 17)
The Board determines annually the railroad industry’s cost of capital. The cost-of-capital figure represents the Board’s estimate of the average rate of return needed to persuade investors to provide capital to the freight rail industry. The Board uses this figure in a variety of regulatory proceedings, including railroad revenue adequacy determinations, rate reasonableness cases, feeder-line applications, rail line abandonments, trackage rights cases, and rail merger reviews. The annual cost of capital figure is also used as an input in the Uniform Railroad Costing System.
The annual cost of capital is calculated in proceeding Docket No. EP 558. (Each sub-docket within that proceeding is for a different year.) The cost of capital figures for the last 14 years are as follows:
| Year | Cost of Capital | Docket |
|---|---|---|
| 2024 | 10.68% | EP 558 (Sub-No. 28) |
| 2023 | 9.87% | EP 558 (Sub No. 27) |
| 2022 | 10.58% | EP 558 (Sub No. 26) |
| 2021 | 10.37% | EP 558 (Sub No. 25) |
| 2020 | 7.89% | EP 558 (Sub No. 24) |
| 2019 | 9.34% | EP 558 (Sub No. 23) |
| 2018 | 12.22% | EP 558 (Sub-No. 22) |
| Year | Cost of Capital | Docket |
|---|---|---|
| 2017 | 10.04% | EP 558 (Sub-No. 21) |
| 2016 | 8.88% | EP 558 (Sub-No. 20) |
| 2015 | 9.61% | EP 558 (Sub-No. 19) |
| 2014 | 10.65% | EP 558 (Sub-No. 18) |
| 2013 | 11.32% | EP 558 (Sub-No. 17) |
| 2012 | 11.12% | EP 558 (Sub-No. 16) |
| 2011 | 11.57% | EP 558 (Sub-No. 15) |
The Board is required by statute to make an annual revenue adequacy determination for each Class I rail carrier. The concept of revenue adequacy is defined at 49 U.S.C. § 10704(a)(2). For purposes of the annual determination, the agency deems a railroad revenue adequate if it achieves a return on investment equal to at least the current cost of capital for the railroad industry. These annual determinations are used to determine whether a rail carrier should be deemed revenue adequate for purposes of assessing whether the carrier’s rates are reasonable. However, it should be noted that in the context of a rate reasonableness case, the Board has stated that revenue adequacy is a long-term concept. As such, agency precedent establishes that in any individual rate proceeding, evidence other than the annual determinations may also be introduced.
The annual calculation is performed in proceeding EP 552. (Each sub-docket within that proceeding is for a different year.) To view those proceedings, use the agency’s Search STB Records tool. Below are links to the last six years of proceedings.
- Railroad Revenue Adequacy — 2024 Determination, EP 552 (Sub-No. 29)
- Railroad Revenue Adequacy — 2023 Determination, EP 552 (Sub-No. 28)
- Railroad Revenue Adequacy — 2022 Determination, EP 552 (Sub-No. 27)
- Railroad Revenue Adequacy — 2021 Determination, EP 552 (Sub-No. 26)
- Railroad Revenue Adequacy — 2020 Determination, EP 552 (Sub-No. 25)
- Railroad Revenue Adequacy — 2019 Determination, EP 552 (Sub-No. 24)
In addition, a chart showing the Board’s annual revenue adequacy determinations going back to 2000 is available here: Click for Excel version or PDF.
Data Submitted by Railroads
Class I railroads are required to file an Annual Report of Finances and Operations, known as the R-1, that contains information about their finances and operating statistics. 49 U.S.C. § 11145(b)(1) & 49 C.F.R. § 1241.11. Each Class I railroad is required to submit a report from an independent accountant stating that specified data in the railroad’s R-1 have been examined, using agreed-upon procedures, and have been found to be in compliance with the Uniform System of Accounts for Railroad Companies, 49 C.F.R. Part 1201. See Certification of Railroad Annual Report R-1 By Independent Accountant, 1 I.C.C.2d 902, Docket No. EP 460 (October 11, 1985). To review the current certification procedures, click here.
Within the R-1 reports is a section titled Schedule 250. This schedule is used to develop rate of return on net investment (ROI) for use in revenue adequacy determinations. A railroad is considered revenue adequate under 49 U.S.C. § 10704(a) if it achieves a ROI equal to at least the current cost of capital for the railroad industry. More information on the concept of revenue adequacy is available under the “Revenue Adequacy” tab above.
The Annual R-1 Reports and Schedules 250 for all Class I railroads are available here.
Quarterly Revenue, Expense, & Income Reports
The quarterly Revenue, Expense, & Income form (Form RE&I) requires Class I railroads to report operating revenues, operating expenses, and income items on a quarterly and year-to-date basis for the current and prior year. 49 C.F.R. § 1243.1. Quarterly reports are available here.
Quarterly Condensed Balance Sheet
The quarterly Condensed Balance Sheet form (Form CBS) requires Class I railroads to show the balance for the current and prior year of the railroad’s assets and liabilities; gross capital expenditures on quarterly and cumulative bases for the current and prior year; and revenue tons on quarterly and cumulative bases for the current and prior year. 49 C.F.R. § 1243.2. Quarterly reports are available here.
Quarterly Earnings Reports
The Quarterly Earnings Report is a compilation of earnings data for all Class I railroads produced by the Board’s Office of Economics on both a quarterly and year-to-date basis. It based on the Class I railroads’ quarterly Revenue, Expense, & Income and Condensed Balance Sheet reports, discussed above. The Quarterly Earnings Reports are available here.
Commodity Revenue Stratification Reports (CRSR)
The STB annually creates three variations of the Commodity Revenue Stratification Report, which show the revenues, variable costs, tons, and carloads by Standard Transportation Commodity Code (STCC). These reports are derived from data in the confidential Carload Waybill Sample. Some data may be redacted to protect confidentiality.
Beginning with the 2020 data year, the 7 Digit STCC report contains more detailed car-type information: specifically, the letter designation followed by 3 digits (e.g., C113, C114). The effect of this enhanced car-type information can be seen by comparing the modified 2020 Stratification Report with the unmodified 2019 Stratification Report. For Barley (STCC 0113110), for example, the unmodified 2019 Stratification Report includes data on a single line for Barley transported in covered hopper cars (code C). The modified 2020 Stratification Report includes separate data for Barley transported in covered hopper car types C113 and C114. In addition, modified 7 Digit STTC reports that contain the enhanced car-type information for 2016-2019 have been added to the website.
The annual reports in which commodities are broken out by 2-Digit and 5-Digit STCC are available here.
The annual reports in which commodities are broken out by 7-Digit STCC are available below.
- 2024
- 2023
- 2022
- 2021
- 2020
- 2019 (Modified 01/11/2023)
- 2019
- 2018 (Modified 01/11/2023)
- 2018
- 2017 (Modified 01/11/2023)
- 2017
- 2016 (Modified 01/11/2023)
- 2016
- 2015
- 2014
This report shows the number of waybill records, carloads, tons, revenue, ton-miles, car-miles, tons per car, revenue per ton, revenue per car, revenue per ton-mile, and length of haul associated with each two-digit STCC from 2010 onward. Data are withheld for some of those STCC/year combinations to protect confidentiality. The spreadsheet is available here. (Updated April 10, 2026)
Annual & Quarterly Freight Commodity Statistics
All Class I railroads are required to report quarterly and annually their car loadings and total revenues by commodity code. 49 C.F.R. § 1248.1 and 1248.2. These reports are derived from information contained in waybills used by railroads in the ordinary course of business. Quarterly and annual reports are available here.
Annual Cars Loaded and Terminated
All Class I railroads are required to submit an Annual Report of Cars Loaded and Cars Terminated (Form STB-54). 49 C.F.R. § 1247.1. Form STB-54 requires Class I railroads to report the number of cars loaded and terminated, by car type, during each calendar year and is due 90 days after the end of the reporting year (March 31). The data are required to support the Uniform Railroad Costing System (URCS), which is the STB’s general purpose railroad costing system. The annual reports for each Class I railroad are available here.
Carloads and Tons Across State
This report, which is produced by the Board, shows the number of carloads and number of tons that either originate, terminate, or pass through each state, as determined from the STB’s confidential Waybill Sample. States with too few railroads or too few railroad customers in any particular year have been redacted for reasons of confidentiality. The report shows data starting in 2012 and is updated every year. A copy of the most recent report is available here. (Updated April 10, 2026).
Commodity Revenue Stratification Reports
The Commodity Revenue Stratification Reports that are listed under the Revenues & Earnings tab also contain information on carloads and volumes.
Tare Weight and Loss and Damage Data
All Class I railroads are required to annually report – either individually or consolidated by the Association of American Railroads (AAR) – tare weight and loss and damage data for use in the Board’s Uniform Railroad Costing System (URCS). 49 C.F.R. § 1249.1 and 1249.2. Tare weights are used in URCS to calculate gross ton-mile costs, while loss and damage data are used in their own URCS cost category. These both make up part of the total variable shipment costs of each rail movement. The reports can be found below.
The annual report of tare weight data can be found here.
The annual report of loss and damage data can be found here.
Quarterly Wage Form A & B
The Class I railroads and the National Railroad Passenger Corporation (Amtrak) report on the Wage Form A & B the number of employees, service hours, compensation, and mileage run, by employee group (executive, officials and staff assistants, professional and administrative, maintenance of way and structures, maintenance of equipment & stores, transportation other than train and engine, and transportation train and engine). See 49 C.F.R. § 1245.2. The Wage Form A & B is submitted by the railroads annually and quarterly. Quarterly reports and annual reports are available here.
Employment Data
The Class I railroads and the National Railroad Passenger Corporation (Amtrak) report on the Form C the average number of employees at mid-month in six job classification groups (executive, officials and staff assistants, professional and administrative, maintenance of way and structures, maintenance of equipment & stores, transportation other than train and engine, and transportation train and engine), encompassing all railroad employees. See 49 C.F.R. § 1246.1. Additionally, the STB compiles this data into a monthly report of “All Employment Data.” The monthly reports are available here.
Wage Statistics
Based on data from the Wage Form A & B, the Office of Economics creates an annual compilation of Wage Statistics (Statement A-300). The “Annual Compilation of Wage Statistics of Class I Railroads in the United States” contains total figures on the number of employees, service hours, compensation, and mileage run for each Class I railroad. Reports are available within the Quarterly Wage A & B Data report tables (“All Railroads” and “Annual” cross-section).
A fuel surcharge is a separately identified component of the total rate that is charged for the involved transportation and that is designed to recoup increases in the carrier’s fuel costs. The manner in which fuel surcharges are assessed and calculated differs between carriers, but in general, they are designed to increase or decrease as the cost of fuel increases or decreases.
In Rail Fuel Surcharges, EP 661 (STB served Jan. 26, 2007), the Board inquired into and made findings regarding rail carrier practices related to fuel surcharges. In its decision, the Board prescribed certain conditions on how rail carriers apply fuel surcharges. Specifically, the Board:
- Held that computing rail fuel surcharges as a percentage of a base rate is an unreasonable practice, as there is no reasonable nexus between such a surcharge and actual fuel consumption;
- Held that the practice of “double dipping,” i.e., applying to the same traffic both a fuel surcharge and a rate increase that is based on a cost index that includes a fuel cost component, such as the Railroad Cost Adjustment Factor (RCAF), is an unreasonable practice;
- Established as a “safe harbor” the use of the Highway Diesel Fuel Index upon which carriers could rely to measure changes in fuel costs for purposes of a fuel surcharge program. [See also Rail Fuel Surcharges (Safe Harbor), EP 661 (Sub-No. 2) (STB served Aug. 29, 2019) (discussing continued use of the safe harbor).]
Subsequently, the Board also imposed a requirement on Class I carriers that they report on: fuel cost, fuel consumption, and surcharge revenues. Rail Fuel Surcharges, EP 661 (Sub-No. 1) (Aug. 14, 2017); 49 C.F.R. § 1243.3. These quarterly reports are designed to provide an overall picture of the use of fuel surcharges by Class I railroads. In addition, the Office of Economics compiles this data to create a quarterly consolidated report. The quarterly reports are available here.
| DOCUMENT/REPORT | DUE DATE | BLANK FORM - EXCEL OR CSV | BLANK FORM - PDF |
|---|---|---|---|
| Form R-1 | March 31 of the Following Year | Form R-1 (EXCEL) | Form R-1 (PDF) |
| Form R-1 Sched. 250 | April 30 of the Following Year | Part of R-1 form | Part of R-1 Form |
| Carloads Loaded and Terminated (STB-54)
(OMB Control No. 2140-0011, exp. 2/29/2028) |
90 Days After End of Year | Form STB-54 (CSV) | N/A |
| Revenue, Expenses & Income (REI)
(OMB Control No. 2140-0013, exp. 2/29/2028) |
30 Days After Close of Quarter | Form RE&I (CSV) | N/A |
| Condensed Balance Sheet (CBS)
(OMB Control No. 2140-0012, exp. 2/29/2028) |
30 Days After Close of Quarter | Form CBS (CSV) | N/A |
| Freight Commodity Statistics (FCS)
(OMB Control No. 2140-0001, exp. 2/29/2028) |
60 Days After End of Quarter | Form FCS Public (EXCEL) | N/A |
| Employee Compensation
(OMB Control No. 2140-0004, exp. 2/29/2028) |
30 Days After End of Quarter | Form COMP (CSV) | N/A |
| Consolidated Employment
(OMB Control No. 2140-0007, exp. 2/29/2028) |
15 Days After End of Month | Form EMPL (CSV) | N/A |
| Fuel Cost, Consumption, & Surcharge | 30 Days After End of Quarter | Quarterly Fuel Report (EXCEL) | Quarterly Fuel Report (PDF) |
| Annual Report of Tare Weight Data | No later than May 31 | Form Tare Weight (EXCEL) Form Tare Weight Consolidated (EXCEL) |
Form Tare Weight (PDF) Form Tare Weight Consolidated (PDF) |
| Annual Report of Loss and Damage Data | No later than May 31 | Form Loss & Damage (EXCEL) Form Loss & Damage Consolidated (EXCEL) |
Form Loss & Damage (PDF) Form Loss & Damage Consolidated (PDF) |
| Classification Index Survey Form | March 31 | N/A | Blank Form (PDF) |